
Estimate of Production and Per Capita Availability of Milk During 1950-51 to 2012-13 all India
| Year (March to February) | Milk Production (millions tonnes) | Human Population (million nos.) | Per Capita Availability (gram./day) |
| 1950-51 | 17.0 | 359 | 130 |
| 1955-56 | 19.0 | 393 | 132 |
| 1660-61 | 20.0 | 434 | 126 |
| 1968-69 | 21.2 | 518 | 112 |
| 1973-74 | 23.2 | 580 | 110 |
| 1979-80 | 30.4 | 664 | 125 |
| 1980-81 | 31.6 | 679 | 128 |
| 1981-82 | 34.3 | 692 | 136 |
| 1982-83 | 35.8 | 708 | 139 |
| 1983-84 | 38.8 | 723 | 147 |
| 1984-85 | 41.5 | 739 | 154 |
| 1985-86 | 44.0 | 755 | 160 |
| 1986-887 | 46.1 | 771 | 164 |
| 1987-88 | 46.7 | 788 | 162 |
| 1988-89 | 48.4 | 805 | 165 |
| 1989-90 | 51.4 | 822 | 171 |
| 1990-91 | 53.9 | 839 | 176 |
| 1991-92 | 55.7 | 856 | 178 |
| 1992-93 | 58.0 | 872 | 182 |
| 1993-94 | 60.6 | 892 | 186 |
| 1994-95 | 63.8 | 910 | 192 |
| 1995-96 | 66.2 | 928 | 195 |
| 1996-97 | 69.1 | 946 | 200 |
| 1997-98 | 72.1 | 964 | 205 |
| 1998-99 | 75.4 | 983 | 210 |
| 1999-00 | 78.3 | 1001 | 214 |
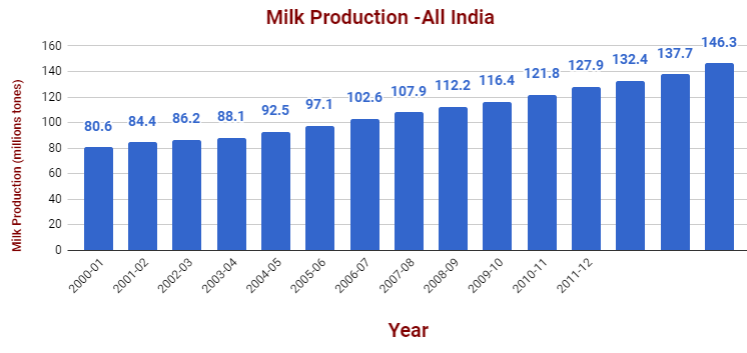
| 2000-01 | 80.6 | 1019 | 217 |
| 2001-02 | 84.4 | 1040 | 222 |
| 2002-03 | 86.2 | 1056 | 224 |
| 2003-04 | 88.1 | 1072 | 225 |
| 2004-05 | 92.5 | 1089 | 233 |
| 2005-06 | 97.1 | 1106 | 241 |
| 2006-07 | 102.6 | 1122 | 251 |
| 2007-08 | 107.9 | 1138 | 260 |
| 2008-09 | 112.2 | 1154 | 266 |
| 2009-10 | 116.4 | 1170 | 273 |
| 2010-11 | 121.8 | 1210 | 271 |
| 2011-12 | 127.9 | 1186 | 290 |
| 2012-13 | 132.4 | 1212 | 299 |
| 2013-14 | 137.7 | 1229 | 307 |
| 2014-15 | 146.3 | 1245 | 322 |
Note: Population projected as on 1st March based on Census of India -2001 of RGI, India
(Source: State/UT Animal Husbandry Departments)
References:
Extracted from “SOUVENIR- 45th Dairy Industry Conference & IIDE 2017”, (Bombay Convention & Exhibition Centre Goregaon East, Mumbai-400063) dated 16th to 18th February 2017. Page-54-55.